Spot price analysis in Norway in regard to energy arbitrage using batteries
This technical analysis done at Hagal presents some data-driven reflections on the feasibility of energy arbitrage using batteries.
Intro
There has been a tremendous amount of discussions about the high energy prices these last months, driven by historically high energy prices in the Nordic countries. Norway has recently seen its highest daily average price with €156/MWh in average for the Friday 26th of November. This energy price, or spot price, are decided in the day-ahead market (at NordPool in Norway) and sets the price of energy per hour. End users, both private and businesses, sign a contract with an energy market provider (Tibber, Fjordkraft, Fortum) that sell them energy at the spot price.

The spot price, as shown in Figure 1 for the Oslo region (NO1), varies from hour to hour. A quick summary statistics (Figure 2) where we look at the maximum and minimum prices for each day in the analysed period shows the following pattern:
- the most common hours in a day with the minimum price are during the night (hours starting at 2, 3 and 4)
- the most common hours in a day with the maximum price are during the morning (hours 9, 10, 11) and afternoon (hour 17)

At Hagal, the discussion about using batteries to take advantage of this difference in price is recurrent. This use-case, called energy arbitrage, is simple to understand. During the cheaper hours of a day, a battery is charged at the cheaper prices. During the more expensive hours of the day, the battery is used as an energy provider, thus requiring to draw less energy from grid at these hours. As the spot price for the next day is published around 12:45 (Europe/Oslo timezone) every day for the next day, then a simple algorithm could implement this use-case.
Energy arbitrage, on its own, has been shown not to be profitable in the past years for existing batteries. Therefore at Hagal we believe that batteries should always be thought as multi-revenue source by implementing revenue stacking schemes using optimization algorithms. A revenue stacking scheme we often encounter is the combination of the following three use cases: increase PV self consumption, peak shaving and energy arbitrage. By using forecasting algorithm and knowledge about spot prices, optimization of battery use in regard to these three use-cases is feasible.
But how profitable is this ? This is what we try to start digging into in this analysis.
Energy cost and grid cost
Before we dive into the analysis, it is important to remember your energy bill is made of to two parts :
- electricity cost : what you pay for the energy delivered at your industry
- grid cost : what you pay to the distribution system operator (DSO, Elvia in Oslo for example) for getting energy 24/7 delivered at your industry
In addition, the grid costs are made of three parts:
- fixed part: taxes, etc…
- energy part: a fee per energy used (often in øre/kWh)
- power part: a fee related to your maximum kW in a given period (in the case of Norway, NOK/kWh/h) There has been some spotlights on the third part (power part) lately as the power part is being implemented for all end users from 1st Jan 2022. How the power part is calculated is dependant on the DSO delivering electricity in your region. As an example, Elvia’s power tariffs for industries looks at the maximum hourly energy (kWh/h) in a given month and uses this value to derive the cost. What this means is that one hour of very consumption can change drastically your electricity bill.
This said, this analysis of energy arbitrage (EA) is focusing solely on electricity cost. Nevertheless, we will see during the analysis that power tariff are important to have in mind.
Variables
Let’s pose the problem we are trying to solve in words, and then let’s define the variables needed to solve this problem. Our objective is the following : given historical spot prices in a certain region (here NO1) and given a battery pack, would the implementation of energy arbitrage be profitable during these past days and can we spot a trend in the evolution of this profitability ?
To answer this question, let’s define some variables:
- spot price :
- $SP_{min,N}$: average of the $N$ hours of minimum spot price (NOK/MWh)
- $SP_{max,1}$: average of the $N$ hours of maximum spot price (NOK/MWh)
- battery :
- $C$: capacity available for energy arbitrage in the battery (kWh)
- $\lambda_{charge}$ : fraction of additional energy required to charge the battery with $C$ (theoretically $\lambda_{charge}$ could be any positive number, in reality it is often between 0.05 and 0.3)
- $\lambda_{discharge}$ : fraction of energy lost when discharging $C$ (between 0 and 1, often between 0.05 and 0.3)
- $N$ : the number of hours required to charge the battery of $C$ without increasing the power tariff
Energy arbitrage in equations
The cost of charging the battery of $C$ during the minimum $N$ hour(s) of the day: \(Charge_{N} = SP_{min,N} \times C \times (1+\lambda_{charge})\)
The savings of discharging the battery of $C$ during the maximum $N$ hour(s) of the day: \(Discharge_{N} = SP_{max,N} \times C \times (1-\lambda_{discharge})\)
Therefore the total savings/costs (NOK) of operating the battery is: \(\Delta_{cost,N} = SP_{max,N} \times C \times (1-\lambda_{discharge}) - SP_{min,N} \times C \times (1+\lambda_{charge})\)
It is also interesting to have an expression independent of $C$ (NOK/MWh): \(\frac{\Delta_{cost}}{C} = \left(SP_{max,N} \times (1-\lambda_{discharge}) - SP_{min,N} \times (1+\lambda_{charge})\right)\)
Then we have a simple metric ($\Delta_{cost,N}$ or \frac{\Delta_{cost}}{C}) to follow :
- if the metric is positive, then energy arbitrage is profitable
- the pattern of this metric informs on potential trends
Results
The two main results are presented below in different forms. Given a charge and discharge loss fraction ($\lambda_{charge}$, $\lambda_{discharge}$, horizontal axis of Figure 3) and a number of hours to charge the battery ($N$, different subplots of Figure 3), the relative gain $\frac{\Delta_{cost}}{C}$ is presented in Figure 3.
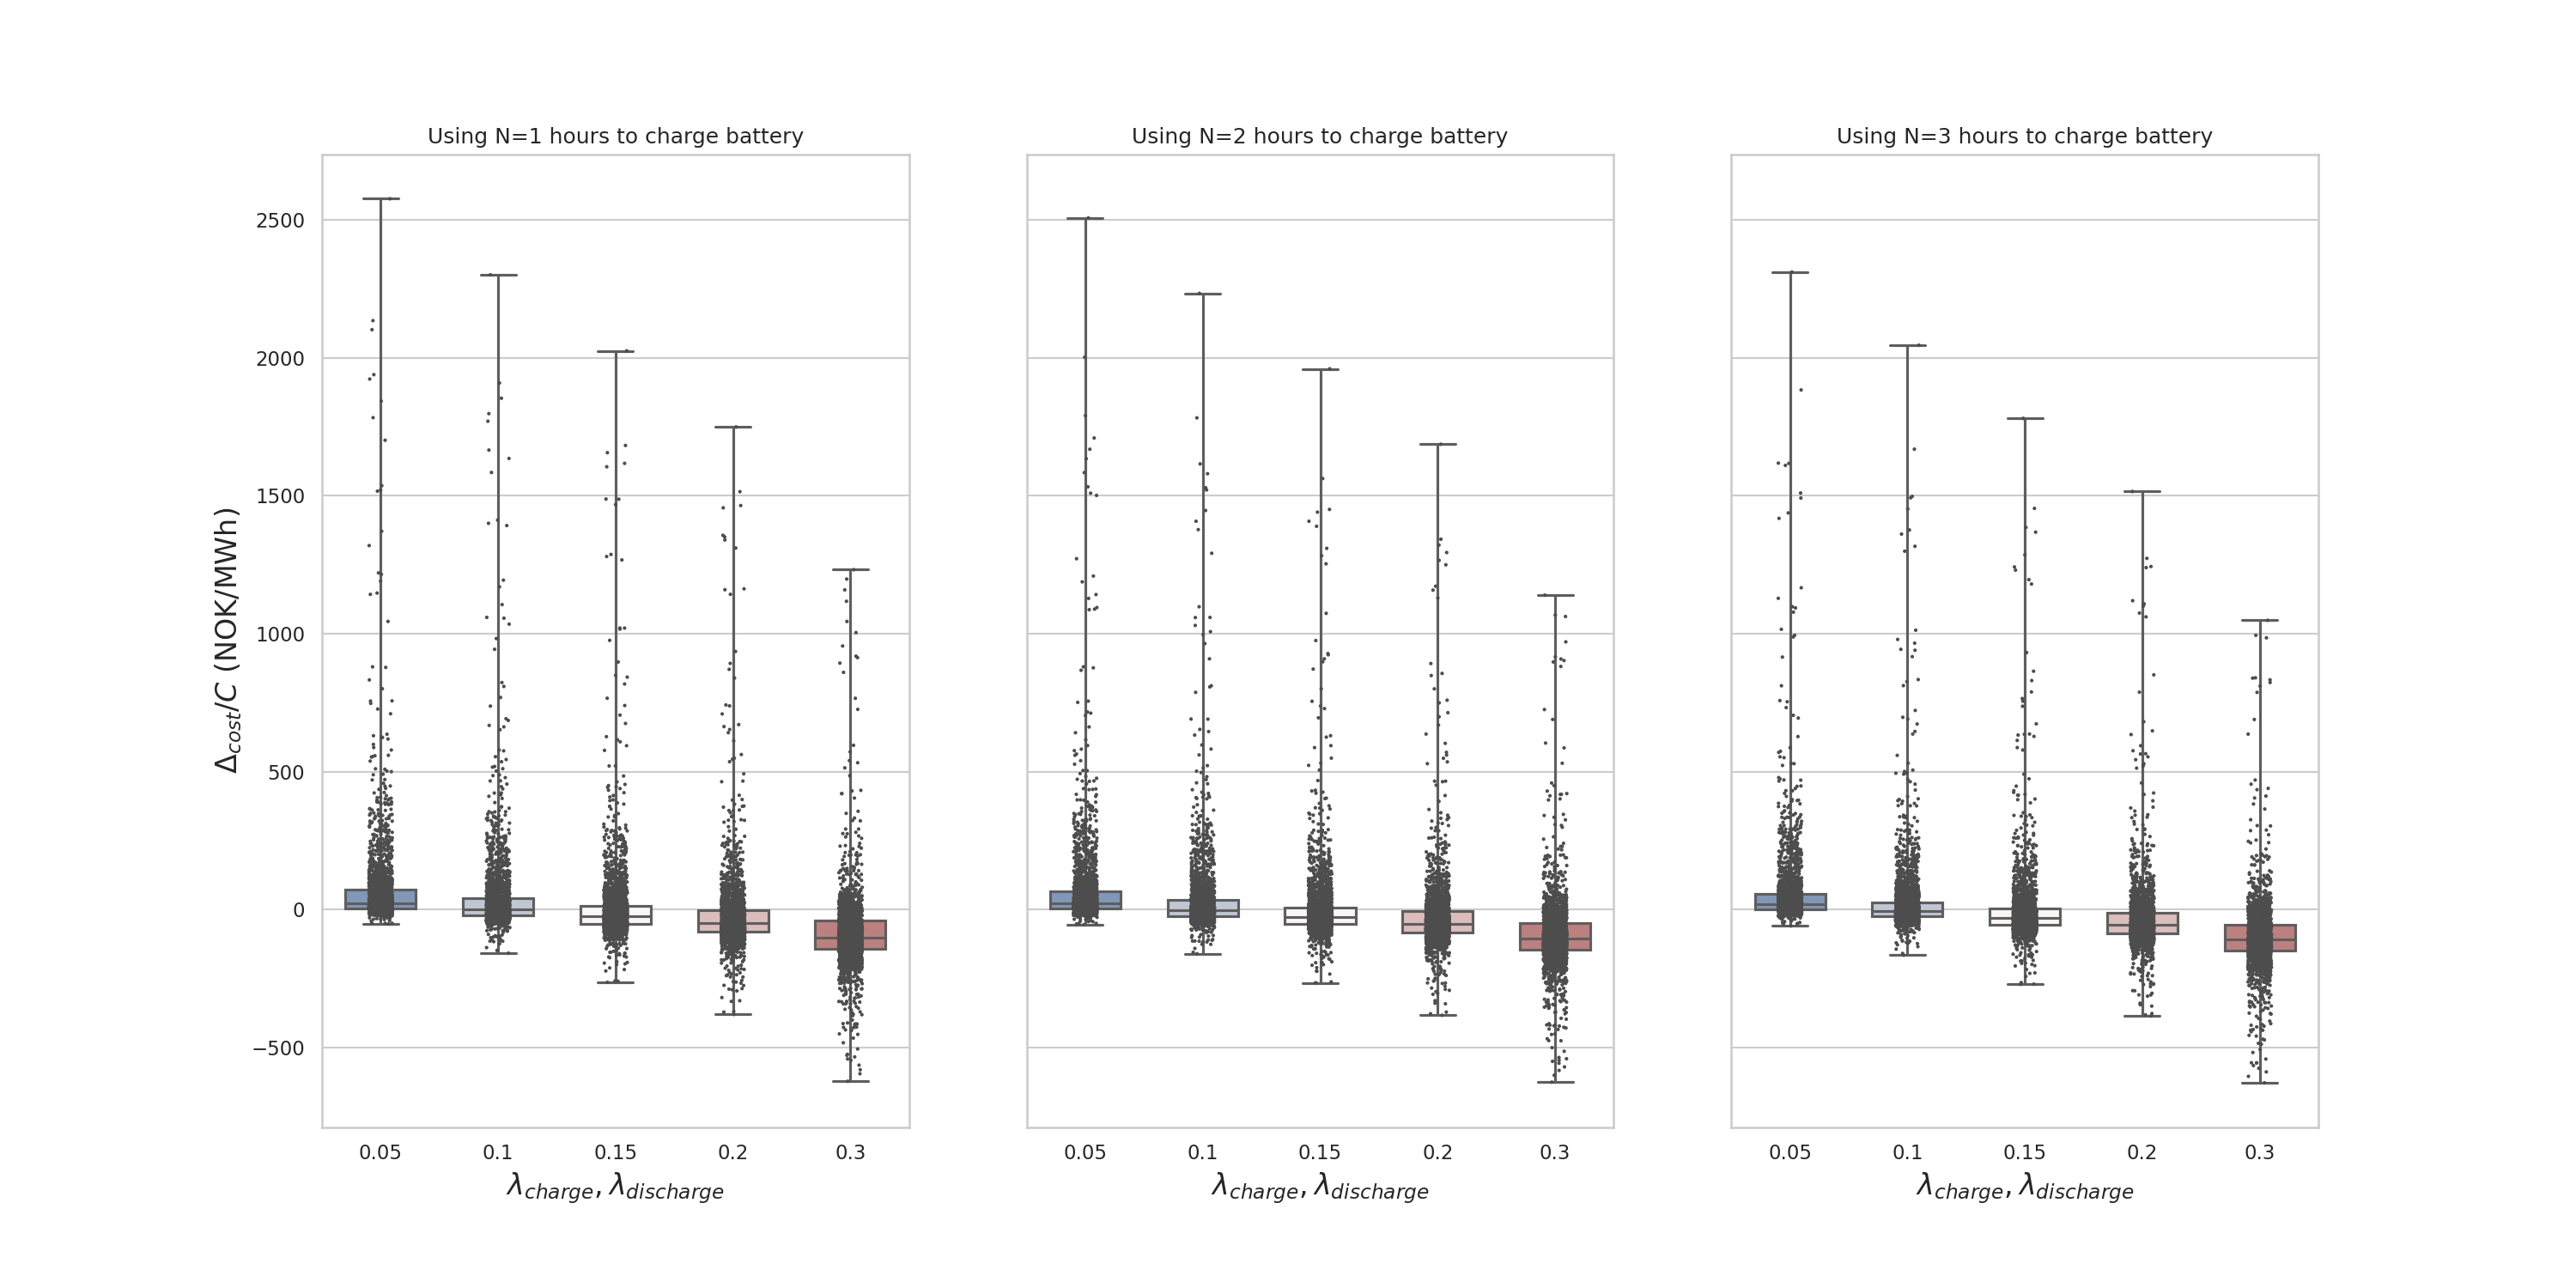
The choice of the parameter $N$ is dynamic and dependant on the size of the battery pack and the consumption patterns of the industry. Let’s give an example here for an industry retail building with very flat consumption, varying from low consumption at night and 100kWh/h during the day. If such industry is acquiring a 250kWh battery pack, then it is not recommended to charge the battery in one hour as the power tariff will increase because of the battery peak during the night. Charging over the three cheapest hours (often at night, so when building consumption is low) is then the good strategy to keep the power tariff at similar levels than previously.
The parameters $\lambda_{charge}$ and $\lambda_{discharge}$ are fixed and battery-dependant, with conventional batteries + inverter being around XX to XX% whereas Hagal unique technology specification would result in a dramatic reduction of these losses.
The Table 1 summarizes the total gains per year that would have been possible with a 250kWh battery with 5% charge/discharge loss.
| 0.05 | 0.10 | 0.15 | 0.20 | 0.30 | |
|---|---|---|---|---|---|
| 2013 | 2308 nok (70%) | 1315 nok (33%) | 802 nok (18%) | 480 nok (12%) | 82 nok (6%) |
| 2014 | 1380 nok (61%) | 775 nok (22%) | 540 nok (10%) | 393 nok (8%) | 182 nok (5%) |
| 2015 | 2698 nok (91%) | 1823 nok (61%) | 1296 nok (44%) | 916 nok (34%) | 400 nok (21%) |
| 2016 | 4664 nok (82%) | 3482 nok (52%) | 2679 nok (33%) | 2087 nok (23%) | 1236 nok (11%) |
| 2017 | 2281 nok (67%) | 1403 nok (31%) | 936 nok (17%) | 649 nok (11%) | 306 nok (6%) |
| 2018 | 5430 nok (91%) | 3377 nok (55%) | 2267 nok (33%) | 1537 nok (22%) | 807 nok (10%) |
| 2019 | 2364 nok (76%) | 1057 nok (31%) | 493 nok (13%) | 233 nok (5%) | 37 nok (1%) |
| 2020 | 1760 nok (85%) | 1295 nok (58%) | 999 nok (38%) | 813 nok (26%) | 534 nok (14%) |
| 2021 | 12949 nok (85%) | 9707 nok (61%) | 7383 nok (44%) | 5615 nok (35%) | 3079 nok (19%) |
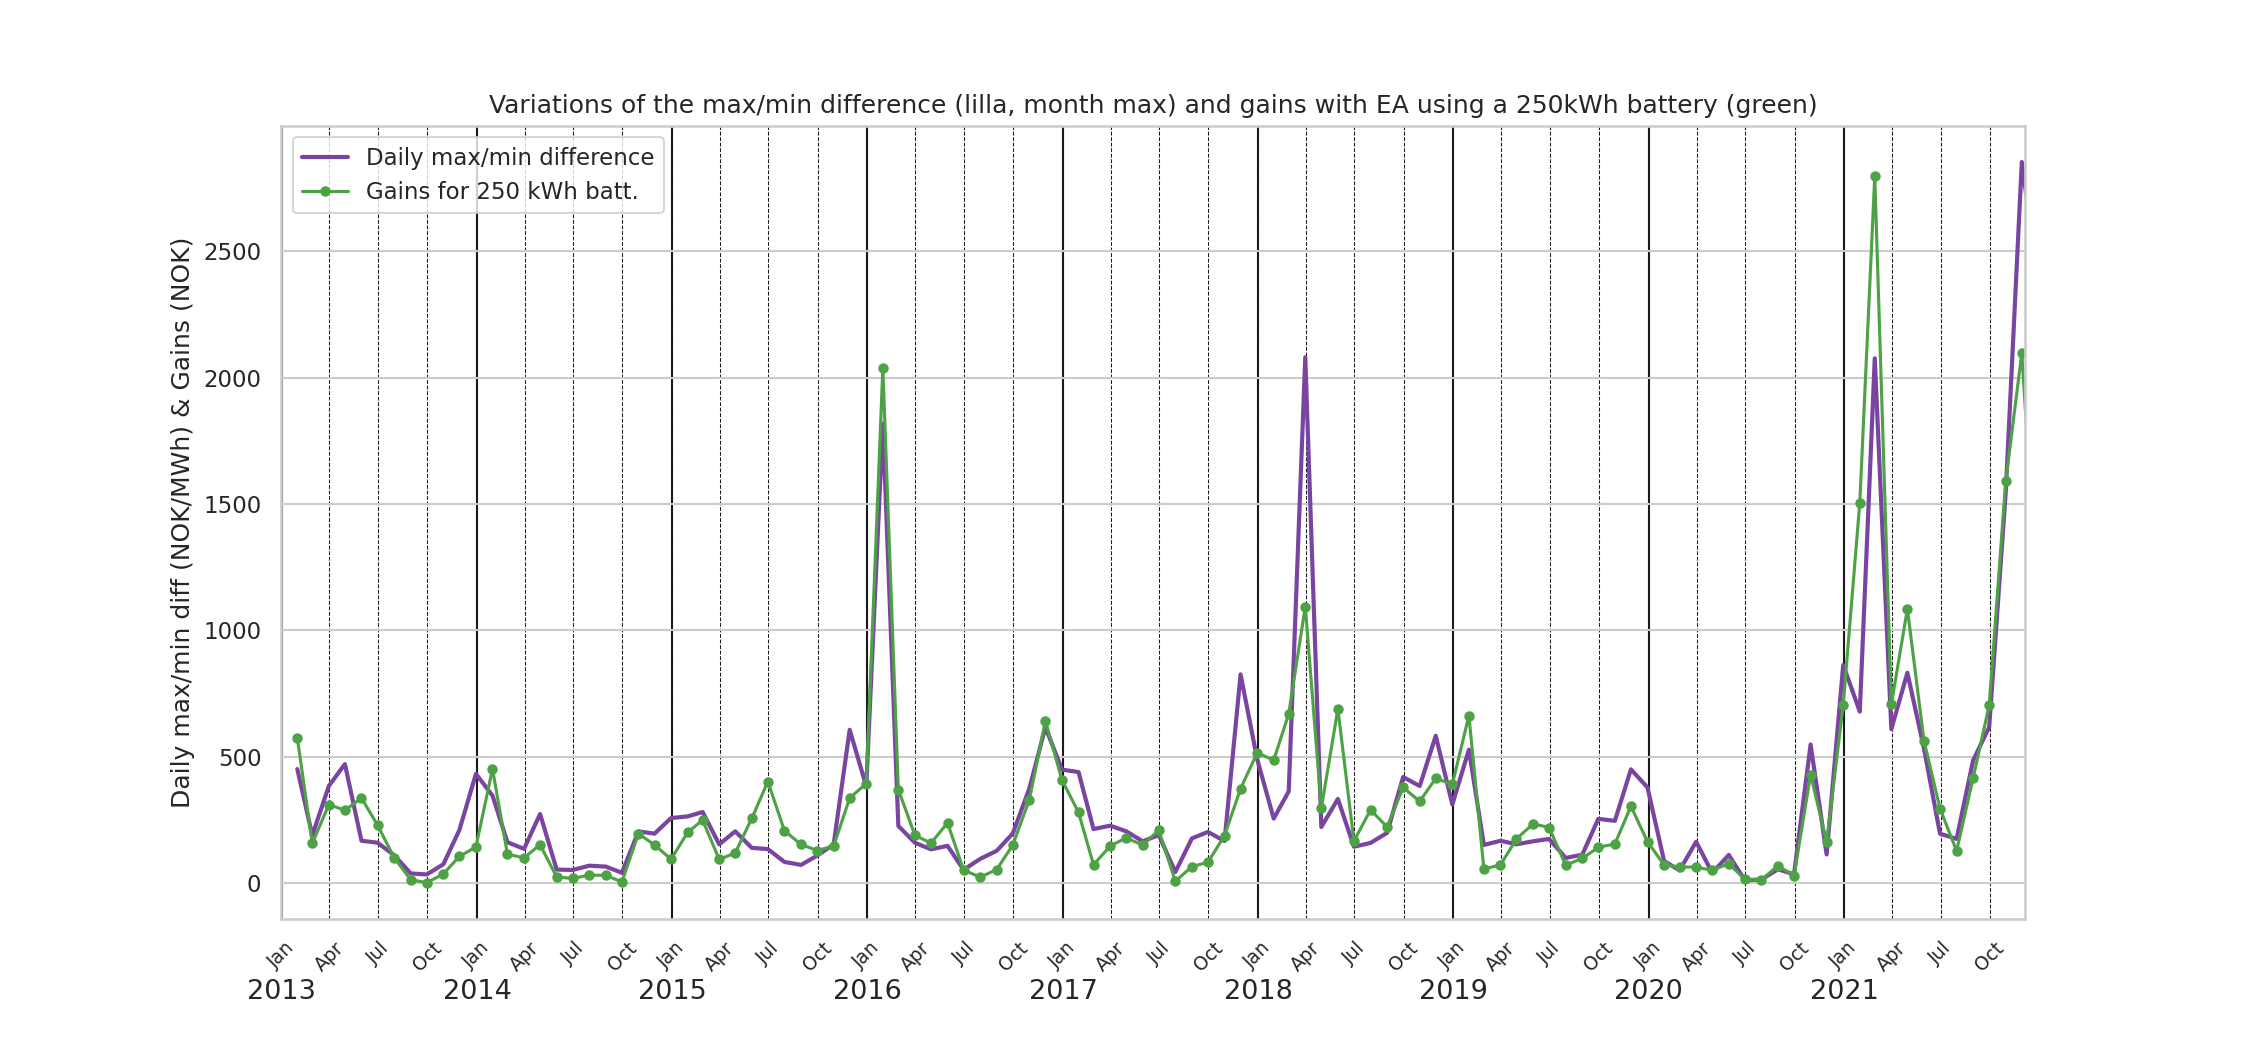
Finally, as one can have expected, we see in Figure 4. a good correlation between the difference between daily maximum / daily minimum and the gains one can expect when using implementing energy arbitrage.
Conclusion
This analysis looks at the relationship between spot price, battery efficiency and energy arbitrage. As spot prices increased dramatically the last months, we see that energy arbitrage gains have also increased. As battery technology is evolving and battery efficiency is getting better, energy arbitrage starts to be a relevant use-case in the revenue stack scheme of your battery park. If you are interested in discussing this topic, or apply this analysis for other regions, please don’t hesitate to contact us.